


Cycling statistics
The veloconomy
Cycling has enjoyed sustained growth since the 2010s, and even more so since the pandemic.
While everyone agrees on the health and environmental benefits of cycling, the link between cycling and economic spin-offs is less well known.
The «veloconomy», or spin-off from cycling, deserves to be highlighted.
Every pedal stroke promotes individual and collective well-being. Here's the proof in figures.


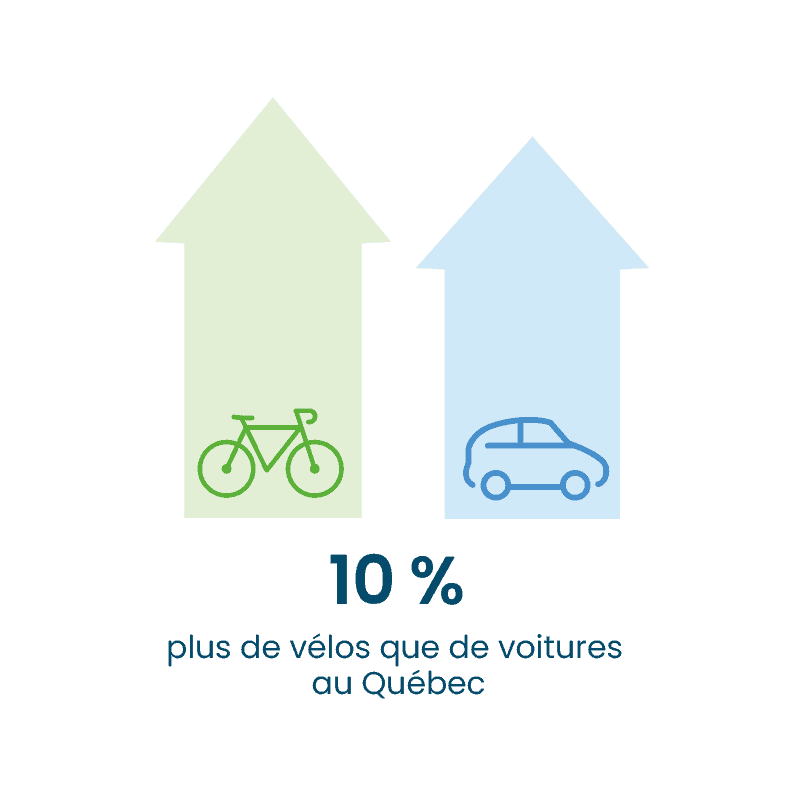
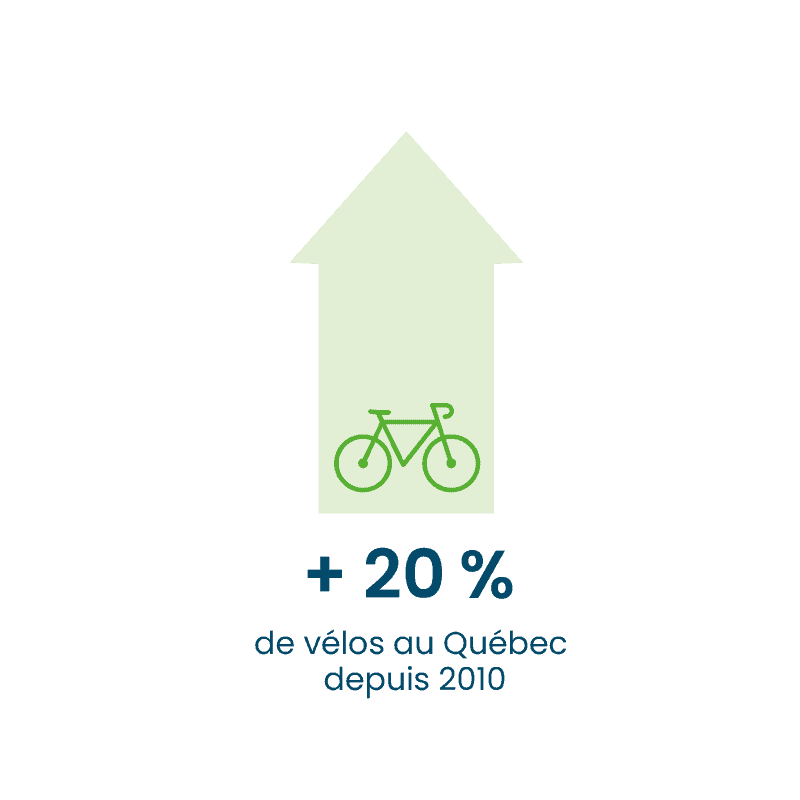
The bike park in Quebec
In 2020, the number of bicycles in Québec will reach 7.2 million bicycles, This represents an increase of 20% over 2010.
Over this period, Quebecers own 10% more bicycles than cars.
These figures reflect a fast-growing bicycle market, with retail outlets and manufacturers in good economic health (sales and maintenance).


The bicycle market in Quebec
The bicycle market - sales of bicycles and accessories - is undergoing a major transformation. sustained growth over the past 15 years.
In constant 2020 values, the market has grown from around 350M$ to 565M$ per year, an increase of over 60%!
Self-service bicycles
Québec was one of the precursors in the implementation of self-service bicycle systems, with Bixi.
In less than 15 years, Bixi has recorded over 50,000,000 journeys since its launch in 2008.
Today, more than twenty municipalities have deployed a system for sharing bicycles throughout Quebec.


Spin-offs from bicycle tourism
Bicycle tourism is a particularly popular activity, and one that generates substantial income. economic benefits.
It's the activity that certainly best embodies the principles of a sustainable tourism, A slow, responsible approach with numerous benefits for our communities.
More than any other mode of travel, bicycle tourism is a way of spreading income over the entire territory.
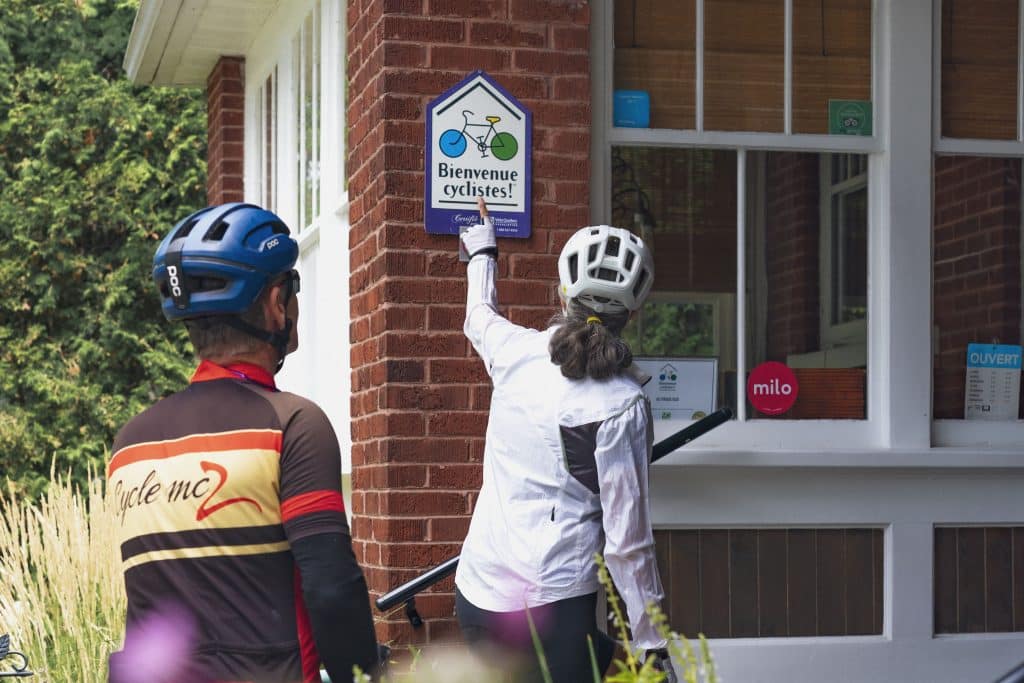
Visit Route verte and certification Bienvenue cyclistes! are two great tools for developing bicycle tourism in Quebec
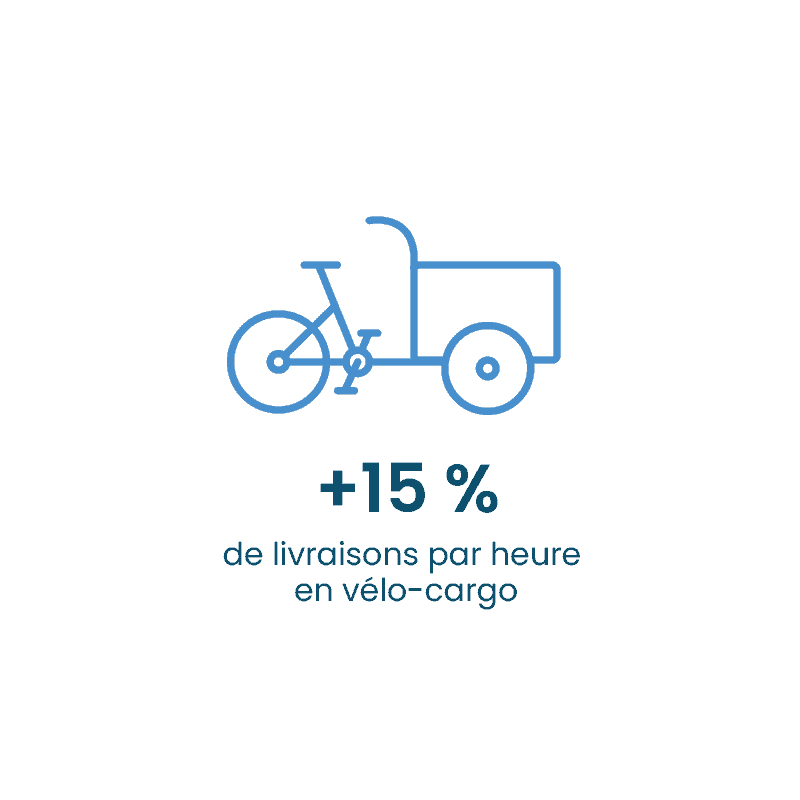
Cyclology
Cyclologistics, or last-mile logistics by bicycle, is booming in many cities around the world. It enables the delivery of goods ranging from simple mail to the most bulky parcels (several hundred kilos!).
Visit Colibri project in Montreal since 2019 has been a success. The project in 2020 :
- 130,000 deliveries
- 80 tonnes of CO2 emissions avoided,
- 130,000 km and 16,000 truck hours avoided
By 2023, the project hopes to achieve 500,000 deliveries and spread across the entire conurbation.
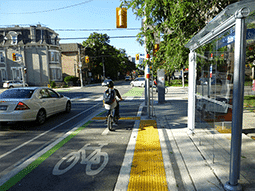
Economic and commercial benefits of cycling infrastructure
The introduction of cycling infrastructure is often a source of concern for residents, and particularly for shopkeepers whose premises border these roads.
In many people's minds, access to car parking is a prerequisite for commercial success. Yet every scientific study shows the opposite (Toronto, New York, London, Copenhagen, Portland, Salt Lake City, Montreal).
Implementing a bike lane always has positive spin-offs for businesses: people on bikes go there more often, their average shopping basket is higher, and overall revenues end up increasing.
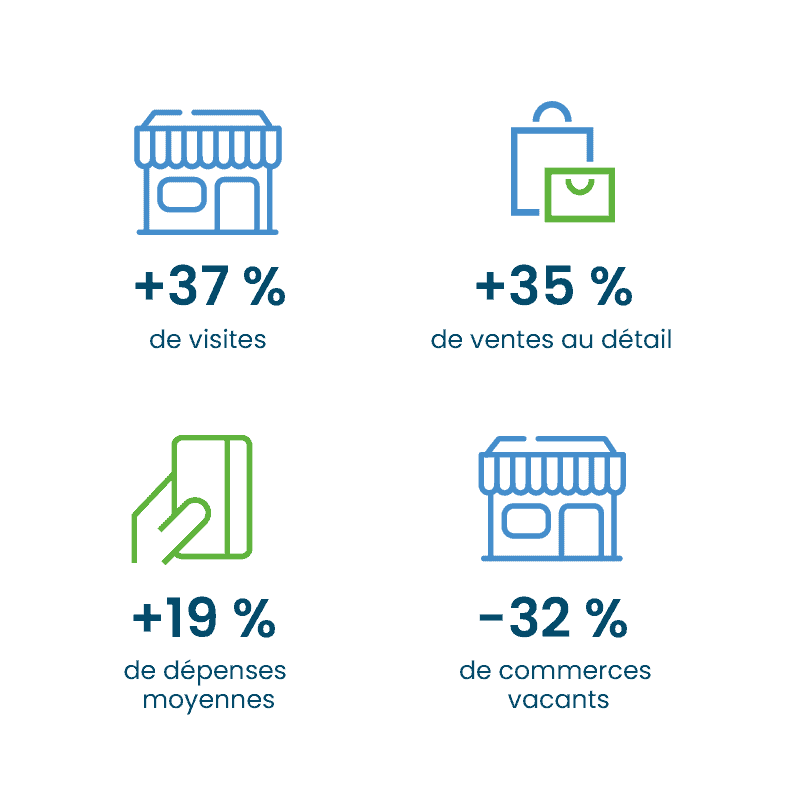
Positive spin-offs for businesses
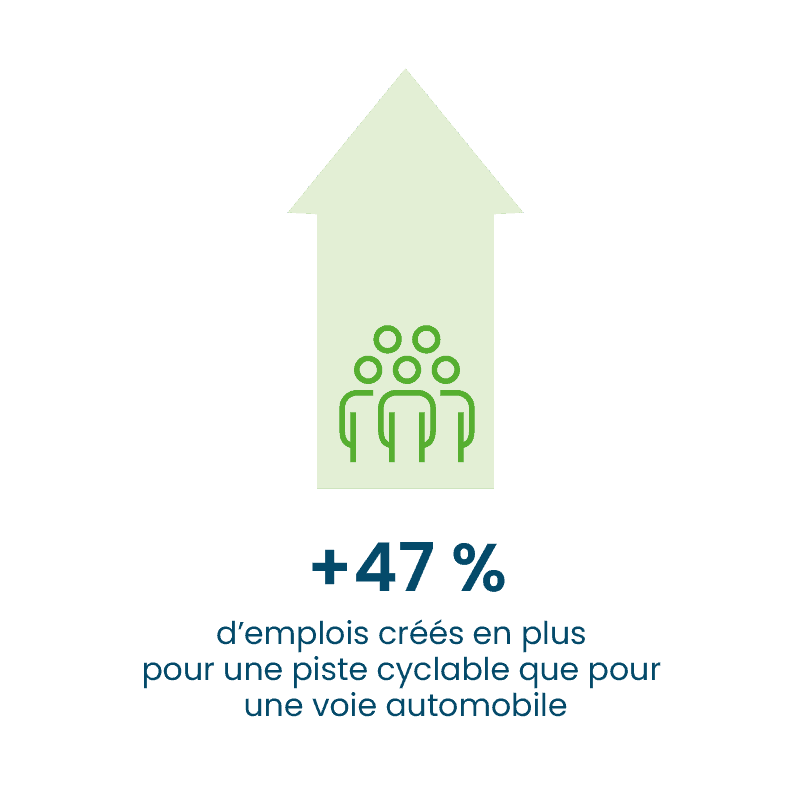
The creation of bike lanes on commercial arteries greatly reduces the vacancy rate of commercial premises. Finally, the construction of bike lanes has positive economic spin-offs for the community insofar as, in addition to the positive externalities for the population (health, environment), it generates the creation of 47% more design and construction jobs than a road without bike lanes.
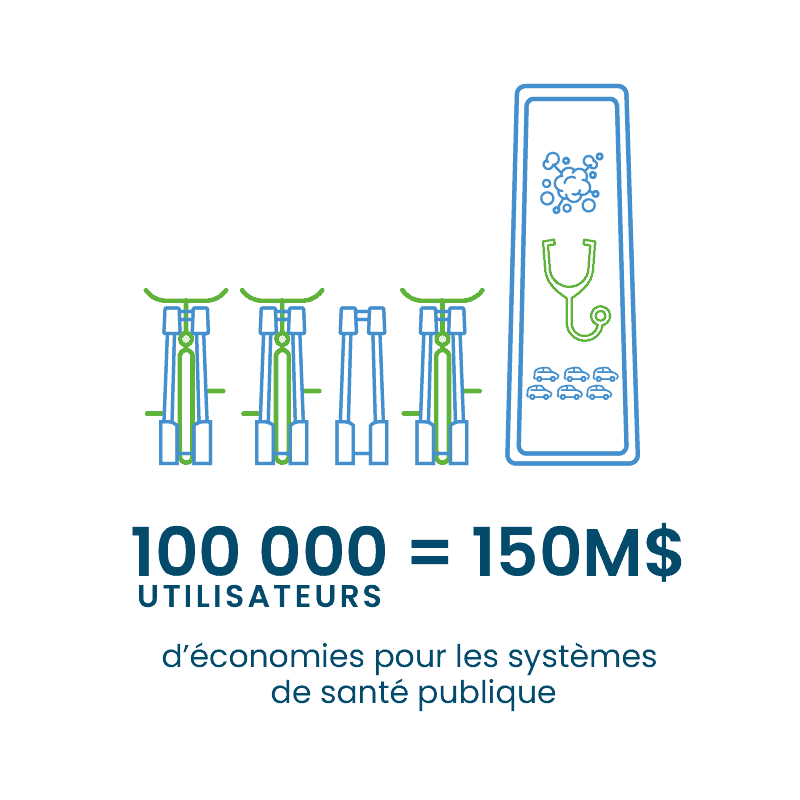
Health benefits
Whether for leisure or for travel, cycling is good for your health. While this fact is widely acknowledged on an individual level, what is less well known is that it is good for society as a whole!
Thanks to a method developed by the World Health Organization (the HEAT method), it is possible to measure the economic impact of cycling on a community. In Quebec, in 2020, the population cycled enough to generate annual economic spin-offs of the order of 2 billion dollars!
These savings can be measured both in terms of the benefits to the body (and hence the illnesses avoided), as well as in terms of the physical activity achieved and the pollution and noise avoided. These savings are equivalent to the construction of almost 1,000 day-care centers per year. Pedaling is not only good for your health, it's also good for the economy!

Bibliography
- The state of cycling in Quebec, 1995, 2000, 2005, 2010, 2015, 2020 editions.
On the evolution of the frequency of visits after the implementation of a bicycle lane:
- Smith Lea, N., Verlinden, Y., Savan, B., Arancibia, D., Farber, S., Vernich, L. & Allen, J. Economic Impact Study of Bike Lanes in Toronto's Bloor Annex and Korea Town Neighbourhoods. Toronto: Clean Air Partnership, 2017.
- M. Carmona, T. Gabrieli, R. Hickman, T. Laopoulou, N. Livingstone, Street appeal: The value of street improvements, Prog. Plan. 126 (2018), pp. 1-51, 10.1016/j.progress.2017.09.001 https://content.tfl.gov.uk/street-appeal.pdf
- Bernier-Heroux, Louis, and Jono Ryan. 2012. East Village Shoppers Study: A Snapshot of Travel and Spending Patterns of Residents and Visitors in the East Village. Transportation Alternatives. https://www.transalt.org/files/newsroom/reports/2012/EVSS_Final.pdf.
- Bent E & Singa K (2009) Modal Choices and Spending Patterns of Travelers to Downtown San Francisco. Transportation Research Record: Journal of the Transportation Research Board, Vol 2115, Issue 1.
- Clifton, Kelly, et al. «Consumer behavior and travel choices: A focus on cyclists and pedestrians.» (2012). New York City Department of Transportation. (2014). Protected Bicycle Lanes in NYC. Retrieved September 19, 2022 from https://www.nyc.gov/html/dot/downloads/pdf/2014-09-03-bicycle-path-data-analysis.pdf
On the increase in expenditure after implementation of a cycle lane:
- The last three studies mentioned in the previous point also studied this aspect.
- City of Copenhagen, Copenhagen city of cyclists, Bicycle Account 2012 (2013) https://docplayer.net/680873-Copenhagen-city-of-cyclists-bicycle-account-2012.html
On the change in sales volume after implementation of a cycle lane (+35%) :
- Andersen, M. (2015, October 6). Salt Lake City cuts car parking, adds bike lanes, sees retail boost. Streetsblog USA. Retrieved September 16, 2022, from https://usa.streetsblog.org/2015/10/06/salt-lake-city-cuts-car-parking-adds-bike-lanes-sees-retail-boost/
- New York City Department of Transportation. (2012). Measuring the Street: New Metrics for 21st Century Streets, retrieved September 19, 2022 from https://www.nyc.gov/html/dot/downloads/pdf/2012-10-measuring-the-street.pdf
- New York City Department of Transportation. (2014). Protected Bicycle Lanes in NYC. Retrieved September 19, 2022 from https://www.nyc.gov/html/dot/downloads/pdf/2014-09-03-bicycle-path-data-analysis.pdf
- McCormick C (2012). York Blvd: The economics of a road diet. UCLA for Los Angeles County Bicycle Coalition.https://nacto.org/docs/usdg/yorkblvd_mccormick.pdf
- M. Carmona, T. Gabrieli, R. Hickman, T. Laopoulou, N. Livingstone, Street appeal: The value of street improvements, Prog. Plan. 126 (2018), pp. 1-51, 10.1016/j.progress.2017.09.001 https://content.tfl.gov.uk/street-appeal.pdf
On the vacancy rate for commercial premises:
- New York City Department of Transportation. (2012). Measuring the Street: New Metrics for 21st Century Streets, retrieved September 19, 2022 from https://www.nyc.gov/html/dot/downloads/pdf/2012-10-measuring-the-street.pdf
- M. Carmona, T. Gabrieli, R. Hickman, T. Laopoulou, N. Livingstone, Street appeal: The value of street improvements, Prog. Plan. 126 (2018), pp. 1-51, 10.1016/j.progress.2017.09.001 https://content.tfl.gov.uk/street-appeal.pdf