


Your reference for everything you need to know about cycling, cycling infrastructure and the benefits of cycling in Quebec.
Highlights
- Significant increase in the number of adult cyclists
- Remarkable rise in the use of bicycles as a mode of transport
- A growing industry, transport cocktail and favorable environments
- Positive health balance thanks to cycling:
- 1 in 9 Quebecers is considered active
- 1 in 3 Quebecers cycle enough to reap the physical activity benefits
Detailed data
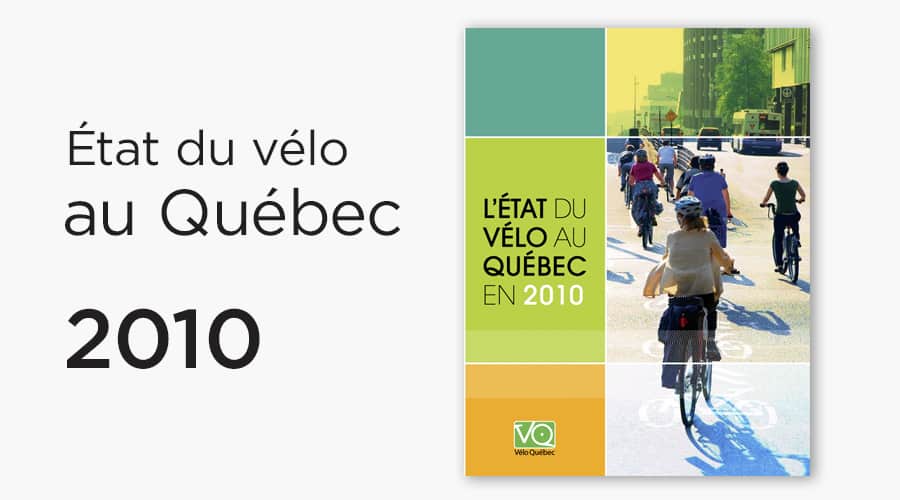
Data from The state of cycling in Quebec in 2010 data come from surveys, counts and inventories carried out specifically for this study. They are supplemented by data from Origin-Destination surveys.
Cycling in Quebec in 2010
The survey covers a multitude of aspects, from bicycle ownership to frequency of travel, and obstacles or incentives to cycling.
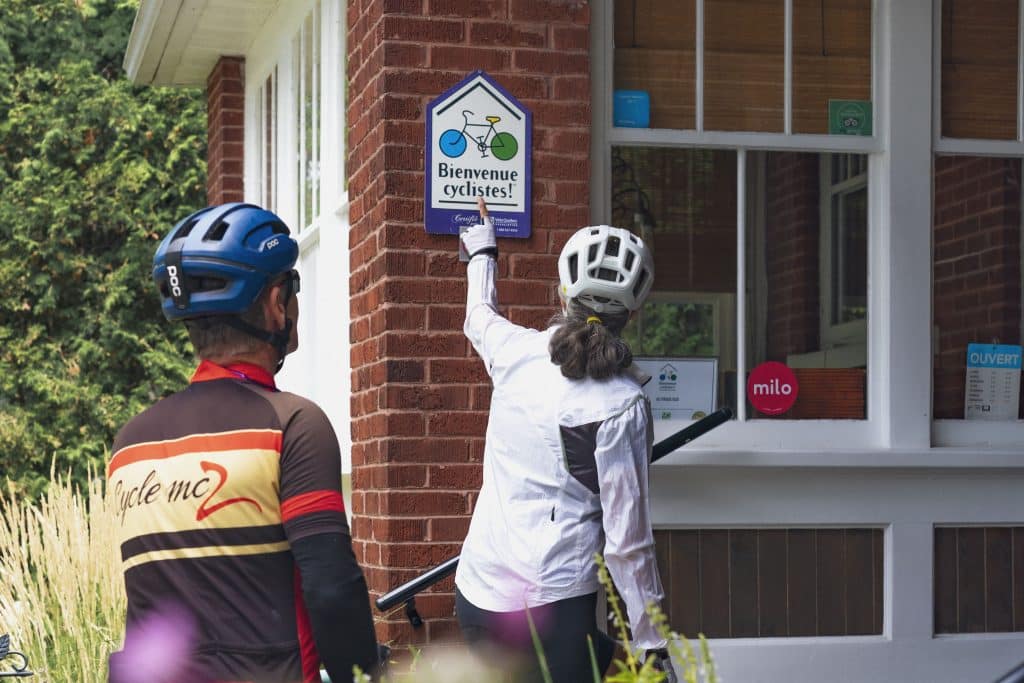
Survey of cyclists who have stayed with us
in accommodation Bienvenue cyclistes!
A survey that compares the behavior of cyclists in general with that of Quebec cyclotourists, and measures their satisfaction with Bienvenue cyclistes! establishments.
Results of bicycle lane counts
An important source of information, the compilation of count activities carried out across Quebec in 2010 is presented below. These counts were carried out by municipalities or trail managers, with the support of Vélo Québec. Data processing and analysis were carried out under the supervision of Catherine Morency of the MOBILITY research chair at École Polytechnique de Montréal.
First, you will find a series of tables and graphs presenting data from the 28 permanent meters distributed throughout Quebec. These meters are mainly found on the Route verte network, with the exception of some meters located on the island of Montreal.
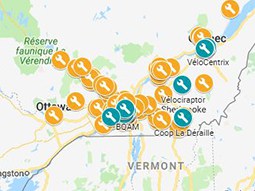
The data from these meters was exported directly from Eco PC, a software package developed by Éco Compteur. The data was then extracted cyclically, in particular to feed the development of an interactive consultation tool presenting statistics on flows observed at the various metering points.
For more information on the methodological approach used to generate these tables and graphs, please consult the report. Valuation of data from permanent and manual bicycle counters.
Below you'll find an information sheet for each of the 28 automatic meters. Each sheet presents data on annual and monthly flow variations, as well as hourly and daily flow rates for the bike lane in question. It should be noted that thirteen of these meters were operational for 365 days, providing a complete annual picture. For the other 15 meters, which were only operational for part of the year, a minimum and maximum extrapolation of the data provides an overall picture of annual ridership.
Finally, manual counts were also carried out by Vélo Québec, mainly in September, October and November 2010 at 110 sites in the seven cities studied by Vélo Québec. The state of cycling in Quebec in 2010. In all, some 202 different counting events (place * day) were coded in the database for systematic processing. The data from these manual counts can be found in the appendix to the report Valorisation des données provenant de comptteurs permanents et manuels de vélo. Please note that to interpret the data correctly, it is essential to refer to the methodological approach presented in section 6.4 of the report.
- Blainville
- Cabano (Bas-Saint-Laurent)
- Cushing (MRC d'Argenteuil)
- Duschesnay (Jacques-Cartier-Portneuf Trail)
- Gatineau (Parc Sanscartier)
- Granby (112)
- Laval (Concorde metro station)
- Lennoxville (CHARMES)
- Lévis
- Longueuil
- Métabéchouan (Véloroute des Bleuets)
- Montréal, Berri bike path, between Ontario and Maisonneuve (Route verte)
- Montréal, Brébeuf bike path, north of Rachel (Route verte)
- Montréal, Côte Sainte-Catherine
- Montréal, Maisonneuve bike path, between Berri and Saint-Denis
- Montréal, Maisonneuve bike path, between Peel and Stanley
- Montreal, avenue du Parc and Duluth
- Montréal, bike path parallel to avenue Pierre-Dupuis
- Montreal, Rachel bike path
- Montréal, Saint-Urbain bike lane, between Villeneuve and Mont-Royal
- Mont-Rolland
- Pont-Alexandra (Gatineau/Ottawa)
- Québec (Promenade Samuel de Champlain)
- Saint-Jean-sur-Richelieu
- Saint-Majorique (Drummondville)
- Trois-Rivières (southern section of the UQTR campus)
- Valleyfield
- Victoriaville (boulevard Labbé)
Origin-destination surveys
Data from the Origin-Destination surveys* have been examined and analyzed to highlight information about walking and cycling that is generally not, or only minimally, covered in the basic analysis of these surveys. Each report presents a portrait of active transportation use for the municipality as a whole, and then for different sectors of the territory. The data is then analyzed according to various variables, such as socio-demographic profile and trip characterization (modal share, motives, etc.).
The following aspects are addressed in this analysis:
- the number of daily walking and cycling trips;
- the proportion of the population travelling on foot or by bicycle;
- the reason for the trip;
- travel ratios by gender and age;
- average travel distance;
- the total distance.
The Chaire de recherche MOBILITÉ at École Polytechnique de Montréal, under the direction of Catherine Morency, has produced seven reports entitled Assistance méthodologique pour le traitement et l'analyse des données des enquêtes Origine-Destination québécoises (Methodological assistance for processing and analyzing data from Quebec's Origin-Destination surveys to draw up a portrait of cycling in Quebec). .
The seven reports correspond to the seven cities studied by The state of cycling in Quebec in 2010, or :
* The Ministère des Transports, which is responsible for these surveys, defines them as follows: Origin-Destination surveys (commonly known as «O-D surveys») provide a portrait of a population and its travel patterns in a given region. These telephone surveys are carried out among a sample of households in the region in question. Respondents are asked to describe all the trips made by each household member during the previous day. Once the data have been collected, a major coding, validation and processing operation is carried out. The resultant computer files are then used for various studies.

All rights reserved 2026
Vélo Québec
Conception de sites web : PAR Design, Agence Web